Research guide
Semaglutide evidence in plain English: reading a severe-event percentage
A guide to the units, classifications and observation rules behind a study result, with a sourced figure and a practical framework for reading it.
Published · 12 minute read
A percentage can look familiar while answering an unfamiliar question. Before deciding what a digestive-event result means, identify what enters the count, who is eligible for the denominator and which observations qualify. Those choices determine whether the figure describes people, episodes, time or something else. A number without those definitions is incomplete information, even when it is copied accurately. The useful first step is therefore to read the heading and its boundaries before reading the height of a bar.
The figure below supplies the study details; this guide develops an editorial reading of their meaning. The aim is to keep separate questions separate: how an event is classified, how a person enters a summary, how an observation window works and how far an inference can travel. Each distinction offers a way to inspect the evidence without turning a group result into a personal forecast. Our guide to reading a prescription addresses a different document; here, the object being interpreted is a research result.
Wide tables can scroll horizontally. Keyboard users can focus a table region and use the arrow keys to move across it.
Reading the evidence
- Identify the unit
- A person, an episode and a day are different things to count. Choose the interpretation that matches the unit.
Sources: Wharton et al.
- Keep classifications separate
- Ask what each label measures before treating similar-sounding terms as interchangeable.
Sources: Wharton et al.
- Read the eligibility rule
- The denominator needs a definition, not merely a convenient total from elsewhere in a report.
Sources: Wharton et al.
- Locate the observation boundary
- A summary can only answer a question about the observations it allows into the calculation.
Sources: Wharton et al.
- Separate description from explanation
- A difference in a descriptive endpoint does not identify the pathway that produced another outcome.
Sources: Wharton et al.
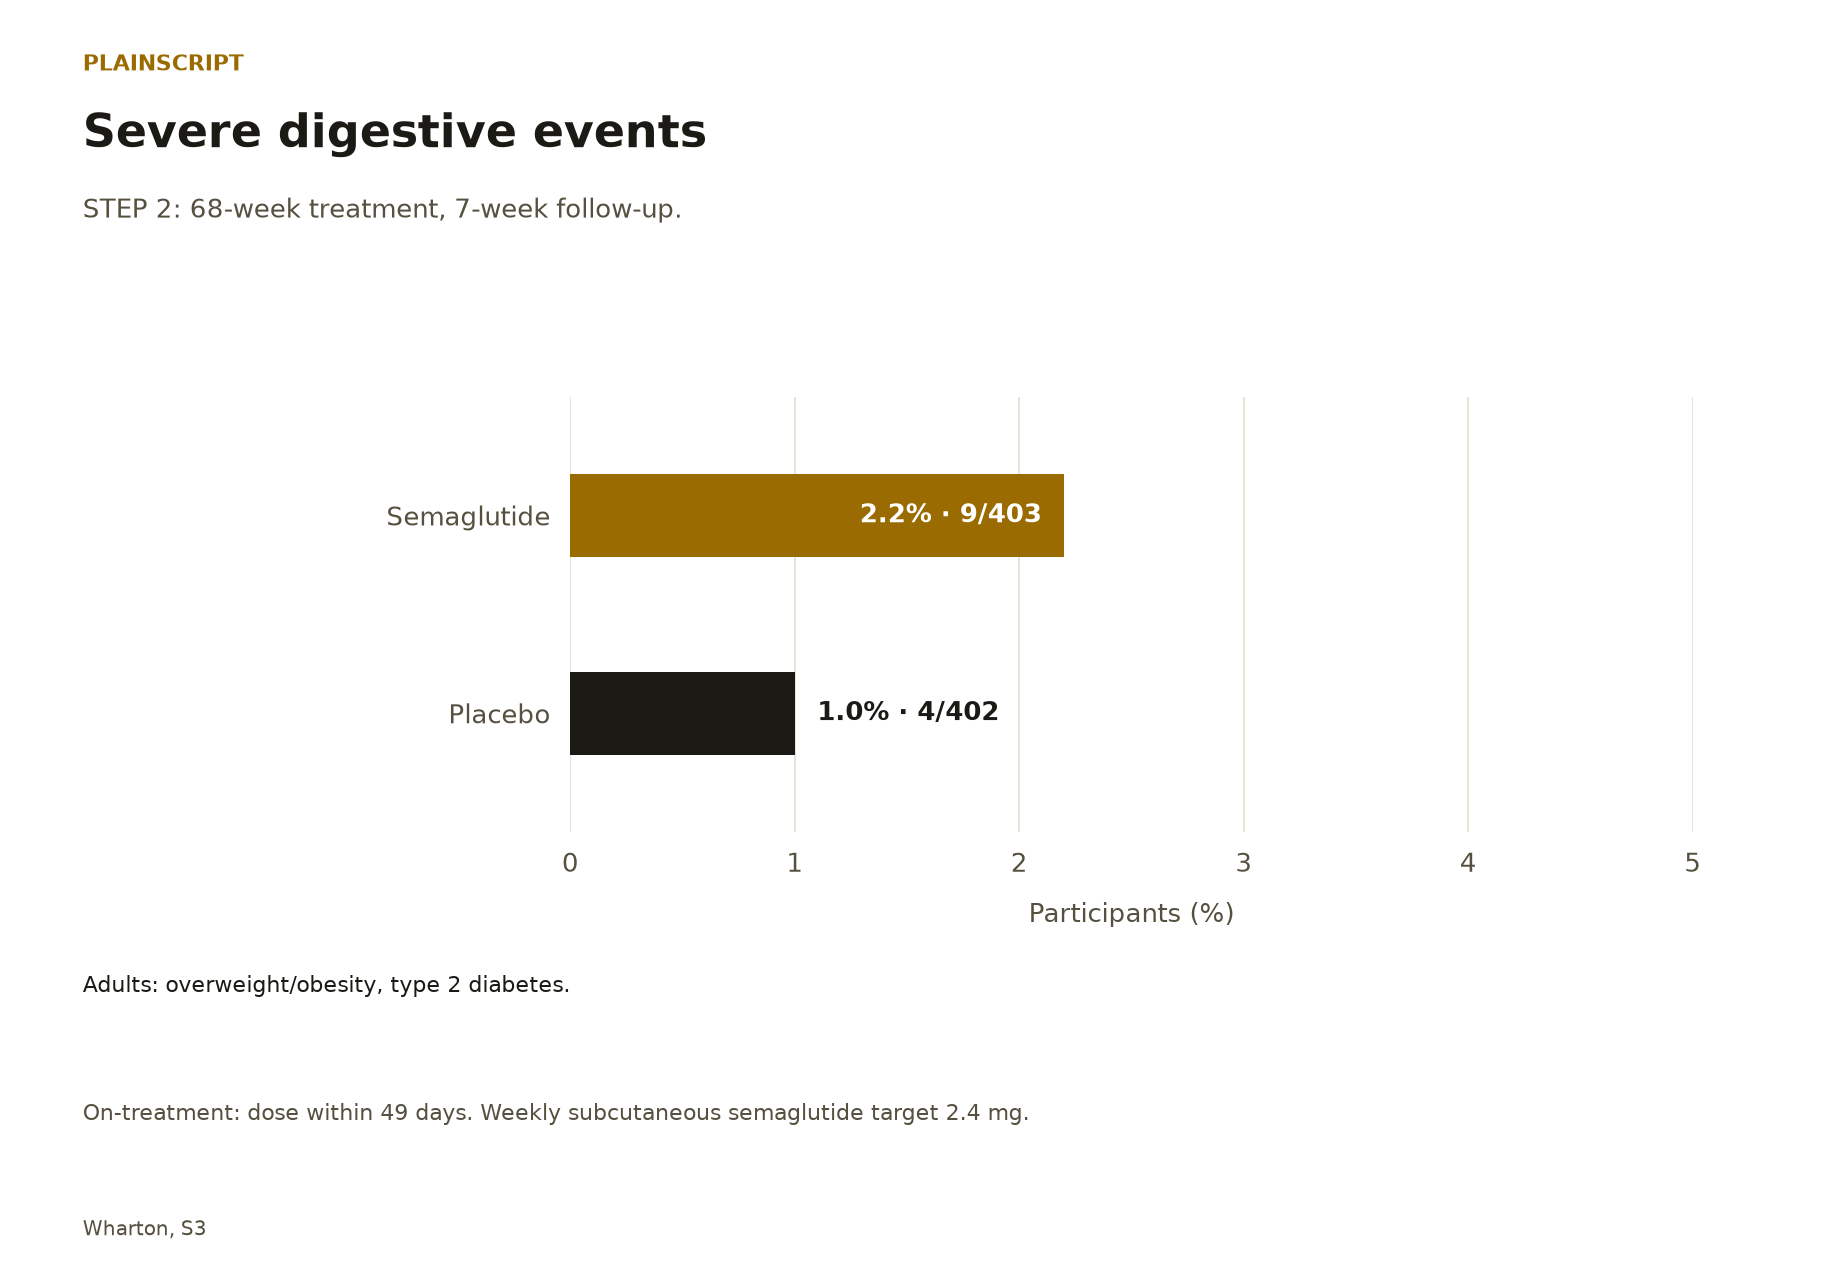
Severe digestive events
STEP 2: 68-week treatment, 7-week follow-up.
Adults: overweight/obesity, type 2 diabetes.
On-treatment: dose within 49 days. Weekly subcutaneous semaglutide target 2.4 mg.
Sources: Wharton et al.
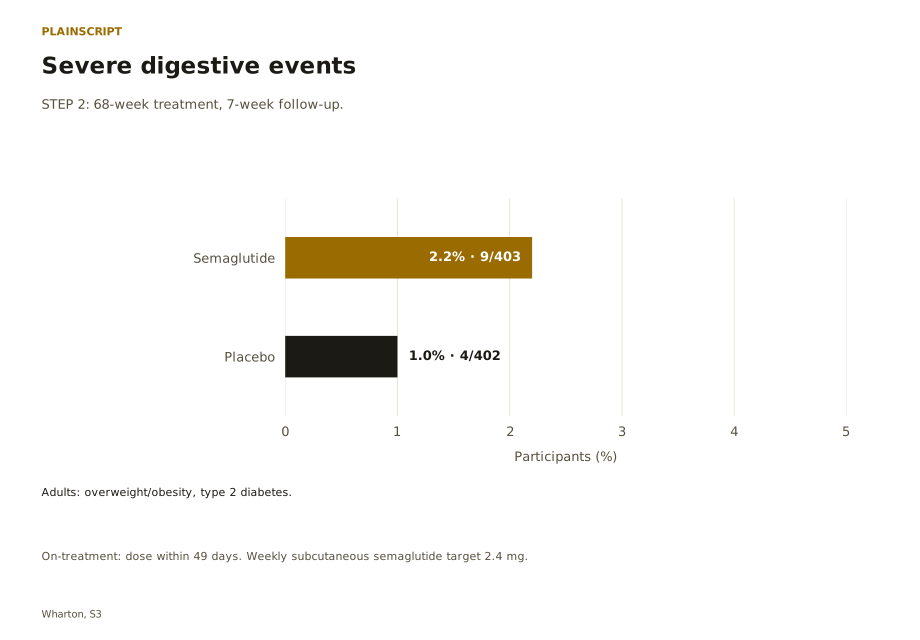
| Arm | n/N | Percent |
|---|---|---|
| Semaglutide | 9/403 | 2.2% |
| Placebo | 4/402 | 1.0% |
Start with the unit the percentage describes
Begin by translating the heading into a sentence with a subject and a rule. If the subject is people, ask what makes a person count. If the subject is episodes, ask what separates one episode from another. If the subject is time, ask how that time was accumulated. These are alternative questions, not alternative ways to decorate the same result. The plain-language sentence should retain the unit throughout the interpretation, including any comparison between rows.
A useful reading exercise is to hide the numerical cells and explain what information would be needed to fill them. This reverses the usual habit of noticing the largest number first. It also exposes category errors early. A question about how often an experience repeats requires a different record from a question about whether it happened at all. Neither record is inherently better; usefulness depends on whether it answers the question being asked.
Return to the displayed figure only after that exercise. Read its row and column labels together, then attach the percentage to the complete phrase they create. If a later sentence changes the subject from people to events, pause and check whether additional data support that move. A clear explanation should make every such change visible.
Sources: Wharton et al.
A person-level indicator compresses a history
Consider the information contained in a yes-or-no indicator for a qualifying experience. Once the condition is satisfied, additional occurrences may leave that indicator unchanged. The summary therefore compresses a potentially complicated sequence into a simpler classification. That compression can be useful for a particular question, but it does not preserve the sequence itself. A reader cannot reverse it to recover recurrence, spacing or duration without further observations.
This is a problem of information, not a criticism of the arithmetic. Different histories can produce the same classification. A person-level proportion could consequently remain identical while the distribution of episodes differs. That possibility does not establish that such a difference occurred in this study; it identifies something the chosen summary alone cannot settle. The appropriate next item to seek would be a measure designed for recurrence or duration, with its own definitions and denominator.
The complement deserves equal care. Absence from a narrowly defined category is not a description of every other experience. It means only that the category did not apply under the relevant counting rule. Reading the complement as a broad account of comfort, functioning or treatment success silently replaces the original question with a much larger one.
Sources: Wharton et al.
Intensity and consequence are different labels
Severe meant preventing normal activities. Novo Nordisk funded the trials in Wharton’s post hoc analysis; three authors were employee-shareholders.
Treat that definition as the meaning of a measurement category, rather than a translation of every ordinary use of the word. Classification systems can describe different dimensions of the same experience. Intensity asks about degree; consequence asks a different kind of question. Categories built for those purposes need not line up. A record may warrant attention along either dimension, so a label from one dimension cannot automatically supply a label from the other.
This matters when a reader moves between a table, a headline and a conversation. Everyday language may collapse distinctions that the analysis needs to retain. The remedy is to keep the original category attached to the result and ask what separate information would answer the other question. Do not infer an unreported category from the apparent size of a percentage or from how alarming its wording sounds.
The funding statement identifies another dimension: the setting in which evidence was produced. It is a reason to examine definitions, analytical choices and transparency carefully. By itself it neither proves that an estimate is wrong nor resolves whether the estimate answers a reader’s question. Those judgments still require attention to the actual measurement and comparison.
Sources: Wharton et al.
The observation window acts like a filter
A trial calendar and an analytical observation window need not be the same concept. The calendar describes when activities occur; the analytical rule decides which records enter a particular summary. To understand a result, imagine applying that rule to a dated record before counting it. The relevant question is whether the record qualifies, not merely whether it happened somewhere within the broader project.
This distinction helps prevent an easy mistake: treating time outside a definition as time during which nothing happened. Excluded observations are outside that calculation. Their exclusion is not evidence that they contained no events, and it does not reveal their likely direction or size. Conversely, including an observation under a rule does not establish the biological cause of what was recorded. Eligibility for analysis and causation are separate judgments.
Read the figure’s timing language as a boundary on interpretation. To answer a question about a different period, a reader would need evidence assembled for that period, or an explicitly justified analysis connecting the periods. A historical counting rule cannot become a waiting instruction. Our discussion of stopping a GLP-1 is further reading about a separate care topic; it does not extend the observation window of this figure.
Sources: Wharton et al.
The denominator belongs to the outcome
The denominator tells the reader which records are eligible to contribute to a proportion. A prominent enrollment figure elsewhere in a paper may answer a different accounting question. Before replacing a denominator, establish that the replacement describes the same people under the same inclusion rule. Otherwise, even an accurately copied numerator can be paired with an incompatible base and produce a result the report never presented.
Different denominators can reflect different questions. That possibility should prompt investigation, not a guess about how many people were lost or why. A reader needs the relevant definition and a documented connection between the counts. Where that connection is unavailable, the uncertainty concerns the accounting relationship. It should not be filled with an invented narrative about adherence, missing visits or unrecorded experiences.
A useful annotation beside a table is a short explanation of the denominator’s job. This creates a check against accidental substitution when summarizing the result later. It also separates the reported estimate from any new calculation a reader might consider. The methods table below lists the evidence needed to resolve common accounting questions; it is an editorial reading tool, not an additional set of trial findings.
| Reading question | Record or definition needed | Inference to avoid |
|---|---|---|
| Who is eligible to be counted? | The inclusion rule for this outcome | Using a different population total without checking |
| What makes a record qualify? | The endpoint definition | Replacing the endpoint with a broader experience |
| Which dates are eligible? | The observation rule | Treating excluded time as event-free time |
| What explains a different total? | A documented relationship between counts | Inventing a reason for the discrepancy |
Sources: Wharton et al.
A treatment target is not a complete exposure record
A group label and an individual exposure history serve different purposes. The label organizes a comparison. A history would describe the path that a person actually followed, with its timing and changes. It is therefore a mistake to read a target in a heading as a complete record of every included person’s experience. Such a record would require information beyond the heading itself.
For interpretation, distinguish the question about assignment from the question about exposure. An analysis organized around assigned groups can address a group comparison without demonstrating identical exposure within each group. An analysis organized around observed exposure would raise its own questions about how records were selected. Those are methodological possibilities to inspect, not claims about undocumented behavior in the participants shown here.
The same discipline applies when reading a medication document. A research target, a product identity and a personal instruction have different roles. Keeping those roles explicit prevents a scientific description from being mistaken for an instruction to begin, change or resume treatment. Our label and paperwork explainer offers a separate document-reading framework. The role of the research heading remains narrower: it identifies the comparison being discussed, rather than authorizing a reader to reproduce a treatment course.
Sources: Wharton et al.
Applicability requires a matching question
Applicability asks whether a result informs a different setting or population. This is sometimes called transportability: moving an inference beyond the circumstances in which its supporting observations were assembled. Start with the population and treatment description printed beside the figure. Then identify what would differ in the proposed application. The point is to make the transfer explicit before deciding whether it is justified.
A shared medication name is only one possible match. Eligibility, formulation, observation practices and the question being asked also matter to the reasoning. Naming those considerations does not establish that any particular difference changes the outcome. It identifies what would need examination. Evidence may leave that transfer uncertain even when the original comparison is clearly described. An unresolved application is a different limitation from an arithmetic error in the original result.
Keep documentary navigation separate from clinical evidence. Our compounding explainer concerns terminology that may appear in product paperwork. The BetterMe Rx review provides another place to inspect documentary terms, without establishing that a provider or preparation reproduces the studied treatment. Neither link supplies a new clinical comparison. An argument about applicability must rest on evidence for the proposed transfer, rather than on proximity between a research article and a commercial review.
Sources: Wharton et al.
A whole-window proportion contains no daily clock
A summary across an observation window does not reveal how its qualifying observations are distributed within that window. The same overall proportion could be compatible with different temporal patterns. It follows that dividing a proportion by an arbitrary number of days or months does not automatically create a valid probability for each interval. That operation needs assumptions about timing and observation that the proportion alone does not provide.
Duration is another separate question. Whether a person ever met a definition does not state how long the experience lasted. Time to the first qualifying event would also require information about when it began and how long each person was observed without it. These quantities may be related in a fuller dataset, but they are not interchangeable summaries. Naming the desired quantity before looking for a number helps avoid borrowing an answer from the wrong column.
Uncertainty has a similar requirement for specificity. A reader should not attach an invented confidence interval to a reported percentage simply to make a chart look more complete. An interval needs an identified method and the information that method requires. When none is displayed, the visual is a descriptive account of the reported values. It does not establish a precise personal forecast or erase uncertainty around the broader interpretation.
Sources: Wharton et al.
Description does not identify a cause of benefit
An endpoint about an adverse experience and an endpoint about treatment benefit ask different questions. Describing the former does not show whether it is necessary for, sufficient for or responsible for the latter. A causal explanation requires a way to distinguish the proposed pathway from alternative explanations. A descriptive percentage is useful evidence about its own endpoint, but it does not perform that additional task by itself.
A related distinction concerns how groups are formed. If treatment is randomly assigned, that assignment is a design feature to examine for the treatment comparison. A group defined by something that happens afterward is created by a different rule. The original randomization does not automatically make that later grouping randomized. Inferring a mechanism from the later grouping would require further reasoning about selection and other explanations. This is a general design distinction, not a new result attributed to the figure.
Our companion tirzepatide guide to stopping outcomes examines another problem of endpoint interpretation. Reading the guides together is a way to compare questions, not a way to rank the medications from unrelated rows. Before drawing a conclusion, state the proposed claim and identify the evidence that would actually distinguish it from competing accounts.
| Proposed question | Evidence needed | What a descriptive percentage leaves open |
|---|---|---|
| When did the experience begin? | Dated observations and an observation-time definition | The timing within the overall window |
| How long did it last? | A duration measure and its rules | The course of an individual episode |
| Did it explain another outcome? | A justified causal analysis | Alternative pathways and selection |
| Does the result apply elsewhere? | Evidence supporting the transfer | Differences between the studied and proposed settings |
Sources: Wharton et al.
Keep study language separate from a care decision
Wegovy’s label contraindicates use with personal or family medullary thyroid carcinoma, MEN2, or prior serious allergy to semaglutide or any ingredient. Its boxed warning concerns thyroid tumors in rodents; human relevance is unknown. Warnings cover pancreatitis, gallbladder problems, dehydration-related kidney injury and severe gastrointestinal reactions. Use with severe gastroparesis is not recommended. Severe or persistent abdominal pain needs prompt assessment. Discuss persistent digestive symptoms with a clinician and notify anesthesia teams about treatment. Trial categories do not provide personal dosing instructions.
There are different reasons to consult a study report and a current label. One supports interpretation of a defined investigation; the other provides prescribing information. A historical event category does not replace the information needed to assess a current symptom or an individual’s treatment. Understanding a classification can improve a conversation without settling that person’s clinical question.
For further reading, the guide to eligibility and interactions addresses a separate topic. The appropriate scientific conclusion here remains a statement about what the displayed measurement means. A careful explanation can be useful while leaving a personal decision to a clinician who can assess the relevant history and circumstances.
Sources: Wharton et al.; Wegovy label
Questions about the evidence
Why read the heading before the percentage?
The heading supplies the subject of the calculation. Without it, a reader may silently exchange people for episodes or an observation window for a daily probability. First explain what would make a record count; then read the numerical result as an answer to that specific question. Accuracy includes both the value and its meaning.
Sources: Wharton et al.
Can a low percentage tell me that an individual experience is unimportant?
No group frequency can make that judgment about an individual experience. Frequency and individual assessment are different questions. A percentage describes how a defined category appears in a particular set of observations. It does not contain the personal history, current circumstances or clinical evaluation needed to decide what an experience means for someone now.
Sources: Wharton et al.; Wegovy label
Is a person outside the category necessarily free of symptoms?
That conclusion would require the category to cover the full question about symptoms. A narrowly defined indicator does not do so merely because its complement is easy to calculate. Interpret the complement under the same definition as the original category; do not expand it into a general description of well-being or success.
Sources: Wharton et al.
What if another table shows a different total?
Find the definitions that connect the tables. A different total may address a different accounting question, but its reason should come from documented information rather than speculation. Keep the numerator with its stated denominator until a justified reconciliation is available. The unresolved relationship should remain visible instead of being replaced with a guessed participant history.
Sources: Wharton et al.
Does a chart establish why two outcomes are related?
A chart can organize a descriptive comparison without identifying a cause. A causal question needs a defined claim, a suitable design or analysis and consideration of alternative explanations. Visual proximity is not that analysis. Ask what observation would distinguish the proposed explanation from another one, and whether the available evidence supplies it.
Sources: Wharton et al.
Editorial assessment
The strongest reading of this figure keeps its question intact from beginning to end. Name the unit, identify what qualifies for the numerator, retain the matching denominator and locate the observation boundary. Then distinguish a description of that endpoint from claims about duration, mechanism or another population. These steps do not diminish the usefulness of a reported result. They identify the work it can legitimately do and the further evidence a different question would require. Our editorial assessment is that precision in these ordinary words matters as much as precision in the numerical cells. A well-explained percentage should leave the reader able to describe its meaning without silently changing what was measured.
Sources and access
- Wharton (2022): semaglutide tolerability
Article and supplement checked.
Checked .
- Rubino (2025): tirzepatide tolerability
Article and supplement checked.
Checked .
- DailyMed: Wegovy prescribing information
Current official label checked.
Checked .
- DailyMed: Zepbound prescribing information
Current official label checked.
Checked .
Coreage Rx pays us a commission on sign-ups through our links. It does not affect our scores or rankings. How we rate · Disclosure